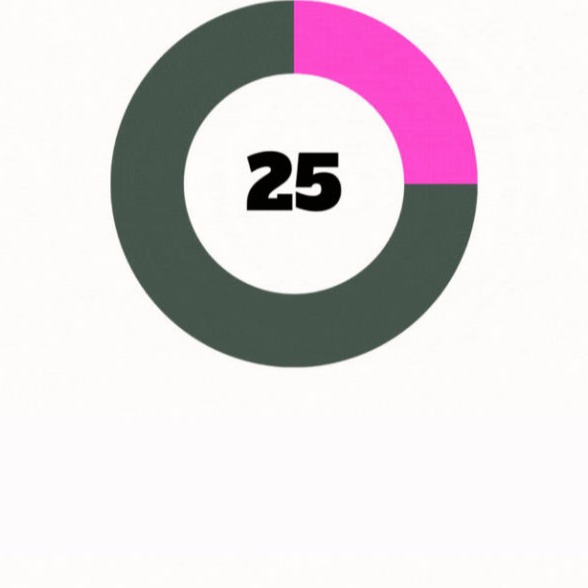
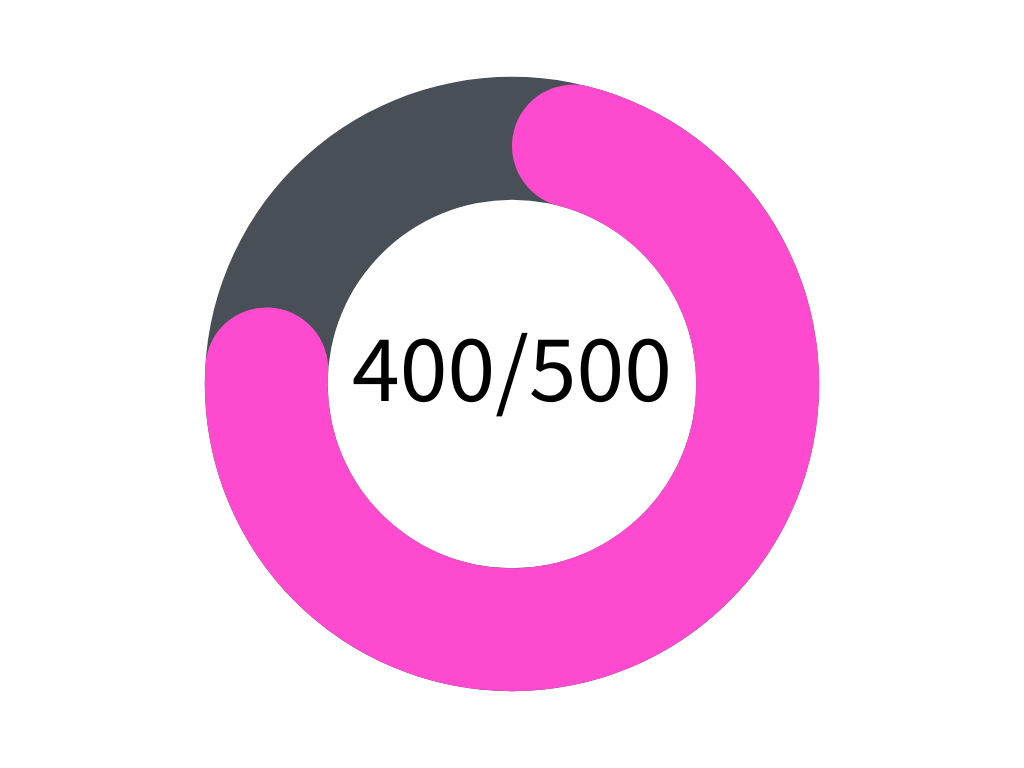
Mobility and Air Quality

Indicator-wise Evaluation

Indicator 1 - Clean Technologies Shared Vehicles

Methodology •The city has to calculate the ratio of annual number of clean technologies shared vehicles to total shared vehicles.

Formula •100 x (Total number of shared vehicles running on clean technology/ Total number of shared vehicle in the city)
Unit • %

Data Sources Required: •Registration data from regional transport office by type of fuel.

Reference: •Moving Forward Together Enabling Shared Mobility in India (NITI Aayog, 2018)
Open Government Data Platform 


Performance Evaluation Levels:

1

0

No clean technology 
shared vehicles
2

25

 Clean technology
shared vehicles:
<5%
3

50

Clean technology
shared vehicles:
5% to <15%
4

75

Clean technology
shared vehicles:
15% to <25%
5

100

Clean technology
shared vehicles:
>25%
Current Score


Results • The percentage of shared vehicles that operate on clean fuel is 0.15 %

Data Evidence•
• In Panaji, there were only 165 battery-operated vehicles registered in 2021.
 Source: Readiness and Capacity Needs Assessment for Electric Vehicle Adoption in Indian Cities, March 2022, TERI

(State Level Data)
• 36 E-Buses are to be used as shared vehicles
 Source: Imagine Panaji Smart City Ltd
• Educational Institution Buses are 189
• Passenger 3 wheelers are 2,519
• Maxi Cabs are 2,689
• Motor Cabs are 24,795
• Motor Cycle for hire are 24,055
• Motor Cabs are 24,795
• Motor Cycle for hire are 24,055
• Passenger buses are 5,248
• Passenger e-Rickshaw are 16
 Source: Open Government Data Platform
• 50 Intercity E-Buses are used as shared vehicles.
Source: KTCL

Mobirise Website Builder

Indicator 2 - Availability of Public Transport

Methodology •The city has to calculate the Public Transport Unit (PTU) of total available public transport which includes fleet size of bus, Metro coach, suburban rail coach and ferries etc. per 1000 population.

Formula •100 x [Fleet size of PT (bus+metro coach+suburban rail coach+ferries ) / Estimated existing population of the city]
Unit • Availability of Public Transport Unit (PTU) per 1000 population

Data Sources Required: • Annual data from Public Transport Authorities, Companies  • Census of India population figures indexed with average annual growth rate for the year 2019 as per SCP.

Reference: •Service Level Benchmarks for Urban Transport (MoHUA, 2010)

Performance Evaluation Levels:

1

0

Public Transport
is not available
2

25

Availability of Public
Transport: <0.2
3

50

Availability of Public
Transport: 0.2 to 0.4
4

75

Availability of Public
Transport: 0.4 to 0.6
5

100

Availability of Public
Transport: ≥0.6
Current Score


Results • Goa has 3.45 Public Transport Units per thousand persons.

Data Evidences•
(State Level Data)
• 36 E-Buses are to be used as shared vehicles.
  Source: Imagine Panaji Smart City Ltd
• Passenger buses are 5,248.
 Source: Open Government Data Platform
• Ferryboats are 38.
Source:
Goa River Navigation Department
• 50 Intercity E-Buses are used as shared vehicles.
 Source: KTCL
• Population of Goa is 1542750.
 Source: Census

Mobirise Website Builder

Indicator 3 - Percentage of coverage of Non-Motorized Transport
network (pedestrian and bicycle) in the city

Methodology •The city has to calculate the total length of footpath and cycle lanes or tracks. Footpath minimum width and cycle                            lane or track minimum width should be as per the street design guidelines of MoHUA. In case of narrow roads, width of cycle track and footpath can be combined.

Formula •100 x [Total length of NMT (length of footpath + length of cycle lane or track network)/ Total road network length ]
      Unit • %

        Data Sources Required: • NMT Network plan of city • Annual completed list of NMT and Pedestrian projects of Public Works department and Municipal Corporations • Bicycle lanes constructed in the city • Map of NMT network in the city as a .kml file (line geometry with optional attribute: width of lanes) • Map of bicycle lanes constructed in the city as a .kml file (line geometry with optional attribute: width of lanes)

Reference: •Promoting Non-Motorized Transport in Asian Cities: Policymakers’ Toolbox (UN-Habitat and Shakti Sustainable Energy Foundation, 2013)
Urban cycling design guidelines (UCDG)


Performance Evaluation Levels:

1
NMT Coverage:
Less than 15%
2
 NMT Coverage:
15% to <25%
3
NMT Coverage:
25% to < 35%
4
NMT Coverage:
35% to < 50%
5
NMT Coverage:
≥ 50%
Current Score


Results • The NMT network in the area is 91% of the total road network.

Data Evidences•
• Total length of Pedestrian Pathway in the study area is 5643 metres. 
• There are no dedicated cycle lanes.
• Total length of Pedestrian Pathway in the study area is 6200 metres.  
Source: Survey

Mobirise Website Builder

Indicator 4 - Level of Air Pollution

Methodology •The indicator assesses the existing city level air quality monitoring mechanism, its strengthening requirements and availability of air quality data on public domain.

Formula •None
Unit •None

Data Sources Required: • Capture levels of PM10 PM2.5, NO x, SO x • Additional pollutants monitored (like CO, NH3, Pb and O3.
• Daily AQI levels are published and available to public through display boards/ SAFAR/ Sameer App/ any other app 
• Reduction in Air Pollution level based on previous year reading
• Reduction trend / incremental improvement in compliance to National Clean Air Programme
• NCAP target (base year 2017)

Reference: •National Ambient Air Quality Standards (NAAQS) (CPCB; 2009)
Central Control Room for Air Quality Management, Delhi NCR

Performance Evaluation Levels:

1

0

No  Consideration
2

25

Basic Monitoring
3

50

Availability of Data in Public Domain
4

75

Air Pollution
Reduction Trend
5

100

Achievement of National Air Quality Standards
Current Score


Results • Monitoring of level of PM10, PM2.5, NO x, SO x, CO, NH3, Pb and O3 & daily AQI levels are published on various apps. 

Data Evidences•
• Capture levels of PM10, PM2.5, NO x, SO x  (as per CPCB Guidelines) is been carried out on continuous basis.
• Additional pollutants monitored like CO, NH3, Pb and O3 etc. as per NAAQS
 Source: Goa State Pollution Control Board
• Daily AQI levels are published and available to public through display boards/ SAFAR/ Sameer App/ any other app (Link to the App)
• There is no reduction Air Pollution level based on previous year reading
• There is no Reduction trend or incremental improvement in compliance to National Clean Air Programme.
• NCAP target has not been met i.e. 20%–30% reduction of PM2.5 and PM10 concentration by 2024 keeping 2017 as the base year for the comparison of concentration.
 Source: Survey

Mobirise Website Builder

Indicator 5 -  Clean Air Action Plan (Planning and Implementation)

Methodology • Indicator assesses to what extent the city has made efforts to improve the air quality, through clean air action planning and proper air quality management strategy in cities.

Formula •None
Unit •None

Data Sources/Evidence Required: •Monitoring Stations for measuring Ambient Air Quality (please indicate number of stations,
differentiate between manual stations/continuous ambient air quality monitoring stations (CAAQMS) / continuous emission monitoring system (CEMS)•Air Quality Monitoring mechanism linked with ICCC/Sensors based monitoring systems
• Map of monitoring stations in the city as .kml files (point or polygon geometry)
• Map of air pollution sensors in the city as .kml files (point geometry)
• Clean Air Action Plan prepared by SPCB based on CPCB guidelines as per National Clean Air Programme, (NCAP) developed
•  Any other Clean Air Action Plan developed by Municipal Authority / Smart City Mission in case of other cities
•  Scientific study based on CPCB / SPCB led Source Apportionment Studies and  Emissions Inventories
• Any other available government validated studies for identifying source/EIs
• Implementation of at least 2 measures under the domain of the ULB as specified in Clean Air Action Plan
•  Impact assessment for  implementation of Clean Air Action Plan measures with  evidence of improvements in air quality


Reference: •National Clean Air Programme (MoEF & CC; 2019)


Performance Evaluation Levels:

1

0

No clean technology 
shared vehicles
2

25

 Clean technology
shared vehicles
<5%
3

50

Clean technology
shared vehicles
5% to <15%
4

75

Clean technology
shared vehicles
15% to <25%
5

100

Clean technology
shared vehicles
>25%
Current Score


Results • Monitoring of level of air pollution is conducted regularly in the area with one monitoring station, and sensor network, Goa Air & Water Rules 2021 is notified.

Data Evidences•
• Monitoring Stations for measuring Ambient Air     Quality, total 18 stations in Goa, 1 in Panaji at Patto. 
• Air Quality Monitoring mechanism is linked with ICCC/ Sensors based monitoring systems
Map of monitoring stations available
• Clean Air Action Plan prepared by SPCB based on  CPCB guidelines as per National Clean Air  Programme, (NCAP) developed
  Source: Goa Water Air Rules 2021
• Scientific study to compare Air Quality between that of pre-pandemic and during pandemic months.
 Source: Report on Impact of Lockdown on AQI
• Map of air pollution sensors in the city prepared
AAQM Data Report for Deepawali 2019

Mobirise Website Builder

Total Score

Total score of all the indicators under Mobility and Air Quality.

Solutions, Strategies & Interventions

To Improve the Score of Mobility and Air Quality

Mobirise Website Builder

Existing Mobility Infra-structure in the City

RE Powered Mobility Plan to Phase Out Fossil Fuel Vehicles

Existing Infra-structure
• Bus terminus with Intra-State Transportation
• Paid Parking Zones inside the city and Ward 28(Patto)
• Para-Transit modes of Transportation
• Private and Public Owned EV Chargers within the Wards under Assessment
• Multi-Level Car Parking at Patto
• Tourist Boat Cruise Jetty

Mobirise Website Builder

New Infra-structure & Planning Initiatives
•  Restrict Movement of IC Engine Vehicle to the periphery of the city by converting the arterial road into ring road.
• Inner city to be electric driven only.
• Provide shared E-bikes rental with daily rates for tourists and monthly concessional pass system for daily commuters for movement inside the city.
• Locate the shared E-bike Stations closer to the ICE driven ring road, Parking and other existing allied infra-structure.
• The phase to be temporary till all personal ICE vehicles are phased out of the city limits.
• Create UI guided bike driven heritage route for tourists with various Points of Interest along it and with strategical placement of businesses & entertainment.
• Generate revenue through enhanced tourism, complimentary EV Charging and Advertisements.

Mobirise Website Builder

Land-Use Feasibility for New Infra-structure
• Convert Existing open Parking into covered Parking using the Designed Modules(details here). 
• Recreational Zones can have ground level bike Stations and solar farms
• Bus terminus and other facility can be covered with PV Panels
• Scheme will generate jobs inside the wards and suitable maintenance industry will be developed.
• By providing staff quarters within the ward the objective of mixed land use is also achieved
• Tourism Department Building (Paryatan Bhavan) has a large available parking area to house a Shared E-bike Station.
• Walking distance from existing Bus Terminus, Multi-Level Car Parking facility and close to the outer ICE RIng Road.
• No new built-up area required.

Mobirise Website Builder

Estimated Power Generation Required for New Infra-structure
• PV Panels can be installed on the rooftops of the existing buildings as well creation of new Solar farms around the city. 
• It is possible to integrate PV system in the south facing facades of the buildings.
• Power can be fed into existing grid infra-structure and used by EV Charger Systems without having to install new infra-structure.
• A large battery bank can solve the problem of uneven weather conditions.

Mobirise Website Builder

Modular Parking with PV Roof & EV Charger
• PV Modules integrated into the roof of parking shed.
• It will shade the pedestrian walkway as well. Modular and mobile.
• Can also act as street furniture for resting pedestrians and EV owners.
• Charging can be free and complimentary for PAID PARKING of EVs.
• Advertisement space can generate extra revenue for the city.
• Can act as an extension of the Shared E-Bike Station.
• Protect parked vehicles from harsh weather.
• It can become a healthy interaction and community space for pedestrians and EV owners charging their vehicles.
• Use power generated by PV panel embedded roof in addition to the power generated by buildings with PV Roofs wothin Ward 19, 20 & 28(Patto) for charging of parked EVs.  

Mobirise Website Builder

RE Powered Mobility Plan to Phase Out Fossil Fuel Vehicles - Phase I

Mobirise Website Builder

RE Powered Mobility Plan to Phase Out Fossil Fuel Vehicles - Phase II

Mobirise Website Builder

RE Powered Mobility Plan to Phase Out Fossil Fuel Vehicles - Phase III

Total Score

Current Score and Estimated Score for Mobility and Air Quality
Mobirise Website Builder
Before Intervention
Mobirise Website Builder
Estimated After Intervention

By Gautam Parwar
M. Arch in Sustainable Habitat, 2022
Goa College of Architecture

 Web Page  Building Software

Created with ‌

Mobirise