Energy and Green Buildings

Indicator-wise Evaluation

Indicator 1 - Electricity Consumption in the City

Methodology •Total electricity consumption (kWh) in the city is calculated. The population data of city is used for per capita calculations.

Formula •Total electricity consumption (in kWh) in the city for the assessment year/Population of the city 
Unit •kWh per capita

Data Sources Required: •Total electricity consumption of the city from DISCOMs. •Census of India population figures indexed with average annual growth rate for the year 2019 .

Reference: •Manual for the Development of Municipal Energy Efficiency Projects (BEE; 2008)


Performance Evaluation Levels:

1

0

 > 10X
compared to
the city with
lowest electricity
consumption
per capita
2

25

> 4X & < 10X
as compared to the
city with the
lowest electricity
consumption per
capita
3

50

> 2X & < 4X
as compared to the
city with the
lowest electricity
consumption per
capita
4

75

 > 1.1 X & < 2X
as compared to the
city with the
lowest electricity
consumption per
capita
5

100

Up to 1.1X
as compared to the
city with the
lowest electricity
consumption
per capita
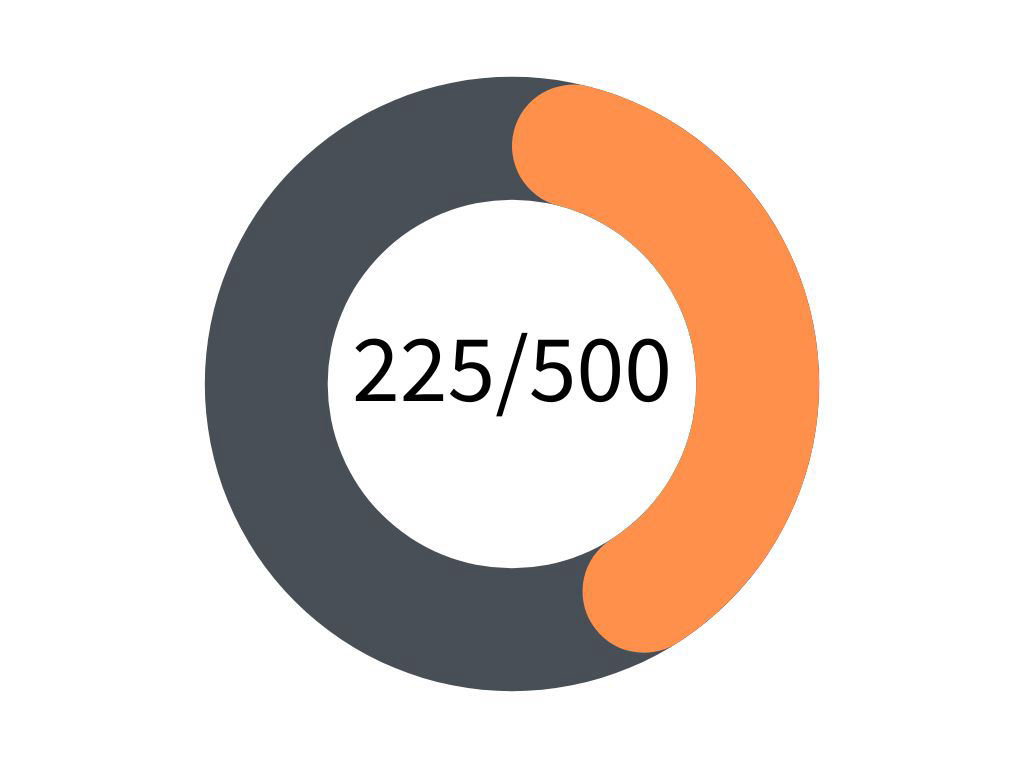
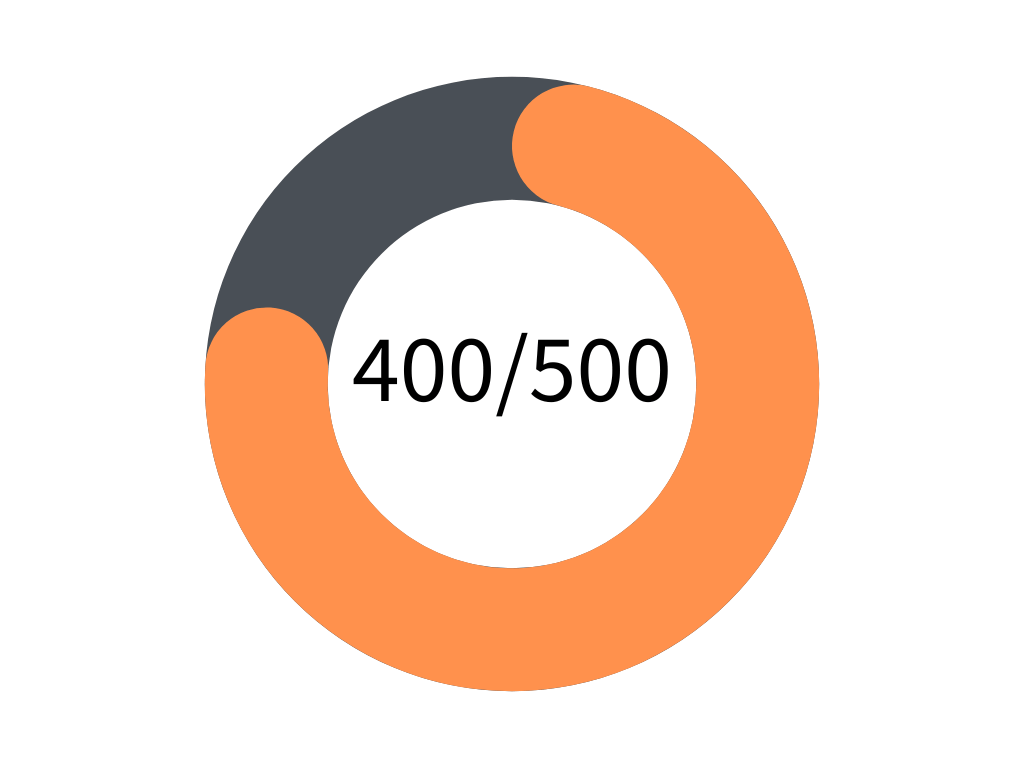
Current Score Level • 1


Results • Per capita consumption of electricity in ward 19, 20, 28 of Panaji is 23.3 times more than that of Bihar which has lowest per capita electricity consumption of 332 KWPhPc (Comparison with State with lowest per capita consumption of electricity due to non-access to ranking of Cities with lowest per capita consumption of electricity).

Data Evidences•
• Total electricity consumption in the area is 36,611,760 KWHr per year.
 Source: Survey, Goa Electricity Department
•Census of India population figures indexed with average annual growth rate for the year 2019 is 4733 persons.
 Source: Census of India 

Mobirise Website Builder

Indicator 2 - Total Electrical Energy in the City Derived from Renewable Sources

Methodology •Total electrical energy in the city is calculated by adding 80% of the ratio of total electrical energy consumption from all grid connected renewable energy sources (kWh) to total electricity consumption (in kWh) in the city and 20% of the ratio of installed capacity of off grid renewable energy sources for self-consumption (kW) to total connected load (kW) in the city

Formula •0.8 x (Total electrical energy consumption in kWh from all on-grid renewable energy sources/
Total electricity consumption in kWh in the city)
+
0.2 x (Cumulative installed capacity in KW of off grid renewable energy sources/
Total connected electrical load in KW in the city) 
Unit • %

Data Sources Required: • Data on total electricity consumption from all grid connected renewable energy sources from DISCOMs
• Data on total electricity consumption and connected electrical load can be obtained from DISCOMs
•  Data of installed capacity of all off-grid renewable energy sources used for self-consumption verified by State Energy Development Agencies.

Reference: •Energy Statistics (MOSPI; 2018)


Performance Evaluation Levels:

1

0

No electrical energy
generated from
renewable sources
2

25

 Renewable
Energy
contribution of
less than 5%
3

50

Renewable
Energy
contribution of
5- 10%
4

75

Renewable
Energy
contribution of
10-15%
5

100

Renewable
Energy
contribution of
> 15%
Current Score Level • 2


Results • Total Electrical Energy in the City Derived from Renewable Sources is 2.20%

Data Evidences•
• Total electrical energy consumption from all on-grid renewable energy sources is 86390 KWHr/yr.
• Total Electricity Consumption in the area is 36611760 KWHr/yr
• Total Cumulative installed capacity of off-grid renewable energy sources is 158004 KW.
• Total connected electrical load in the area is 709386.5 KW.
 Source: Survey, Goa Electricity Department

Mobirise Website Builder

Indicator 3 - Fossil Fuel Consumption in the City

Methodology •Total consumption of Diesel, Petrol, CNG, LPG and PNG are calculated in the city. The consumption of fossil fuel is converted to CO2 emission using respective emission factors. Population of the city is used to assess per capita figures.

Formula •Total CO2e of fossil fuel consumption by the city/Population of the city)
Unit •: Tons CO2 equivalent per capita

(Where, total TCO2e = Total diesel consumption (kL) x 2.62694 + Total petrol consumption (kL) X 2.20307 + Total LPG Consumption (kL) X 1.51906 + Total CNG Consumption (kL) X 0.48066 + Total PNG Consumption (kL) X 0.48066) 

Data Sources Required: •The data on the consumption of petroleum products can be collected by reaching out to the petroleum products distribution companies (e.g. BPCL, IOCL, HPCL and SHELL, etc.)
•Census of India population figures indexed with average annual growth rate for the year 2019 as per SCP.

Reference: •Draft National Energy Policy (NITI Aayog; 2017)


Performance Evaluation Levels:

1

0

 > 10X compared
to the city with
lowest electricity
consumption per
capita
2

25

  > 4X & < 10X as
compared to the
city with the
lowest electricity
consumption per
capita
3

50

> 2X & < 4X as
compared to the
city with the
lowest electricity
consumption per
capita
4

75

 > 1.1 X & < 2X as
compared to the
city with the
lowest electricity
consumption per
capita
5

100

 Up to 1.1X as
compared to
the city with
the lowest
electricity
consumption
per capita
Current Score Level • 2


Results • Total CO2 emission per capita in the City is 1.032 Tons Co2 Equivalent per Capita, which is lower than national Per capita fossil fuel consumption is 1.61 Tons CO2 equivalent per capita.
 Source: World Bank 

Data Evidences•
(State Level Data)
• Annual Consumption of PNG is 8050000 SCM
Source: Annual Report 2022, Goa Natural Gas P.L.

(City Level Data)
• Annual Consumption of Petrol is 18038 KL
• Annual Consumption of Diesel is 16122 KL
• Annual Consumption of LPG is 1246 KL
 Source: Projection, Panjim Solar City Master Plan
• Annual Consumption of CNG is 806 KL
 Source: Survey

(Ward Level Data)
• Daily Consumption of Petrol is 30,500 L
• Daily Consumption of Diesel is 20,800 L
• Daily Consumption of CNG is 1600 KG
 Source: Survey

Mobirise Website Builder

Indicator 4 - Energy efficient street lighting in the city

Methodology •Percentage is calculated for the total number of energy efficient and renewable energy operated streetlights in the city to total number of streetlights in the city.

Formula •100 x [ (Total number of energy efficient street lights + renewable energy operated street lights in the city) /
                           Total number of street lights in the city ]
Unit • %

Data Sources Required: •Total number of streetlights in the city can be obtained from ULB records.
• Municipal records/documentary evidence for the number of streetlights with energy efficient lamps.
• Municipal records/documentary evidence for the number of streetlights operated with renewable energy.
• Map of all streetlights in the city as .kml files (point geometry with optional attributes for energy efficient lamps).

Reference: •Energy Efficient Street Lighting (BEE; 2010)


Performance Evaluation Levels:

1

0

 No streetlights
in the city
is energy efficient
2

25

 Up to 25%
streets lights
in the city are
energy efficient or
renewable energy
operated
3

50

 Up to 50% streets
lights in the city are
energy efficient or
renewable energy
operated
4

75

 Up to 75% streets
lights in the city are
energy efficient or
renewable energy
operated
5

100

All streets lights
in the city are
energy efficient
or renewable
energy operated
Current Score Level • 4


Results • 76.58 percent of total streetlights in the city have energy efficient LED fixtures. 

Data Evidences•
• Total number of street lights in the city are 3322.
• Total number of street lights in the city converted to LED are 2544.
 (Source: Survey, Goa Electricity Department)

Mobirise Website Builder

Indicator 5 - Promotion of green buildings

Methodology •Compliance procedures are only available at state level. Assessment will be on the basis of inclusion of latest provisions of codes, regulations for green buildings at city level, formation of green building cell within city ULBs, availability of promotional or penalty schemes to spur demand for green buildings, and formation of city level green building committee or equivalent for stakeholder co-operation.
 
Formula •None
Unit •None

Data Sources/ Evidence/ Measures Required: •Inclusion of Part 11 of National Building Code (NBC 2016) and/or Energy Conservation Building Codes (ECBC 2017) for commercial buildings & Eco-Niwas Samhita 2018 for residential buildings and/or minimum level of green building rating systems notified in City Development Control Regulations (DCRs/GDCRs) and building rules/bye laws.
 •Functioning of green building cell in ULB for the purpose of knowledge dissemination, creating public awareness, empaneling green building vendors, designing green building schemes and their promotions, verification and faster approvals for green buildings in the city. 
  •Promotional/Penalty schemes available for code compliance, pre- certification, certification of green buildings.
•Functioning of high-level Green Building Committee/ equivalent comprising of ULB’s Commissioner and representatives of ULB green building cell, SPV, PMC, UDD, Town Planner, PWD, Green Building Certification agencies, Developers and Building Professional Associations. The committee will provide strategic advice for the promotion and adoption of energy efficient and green buildings in the city. 

Reference: •National Building Code (BIS, 2016)


Performance Evaluation Levels:

1

0

No measures
implemented
2

25

 One measure
implemented
3

50

Two measures
implemented
4

75

Three measures
implemented
5

100

All four measures
implemented
Current Score Level • 2


Results • Only one out of four measures are implemented and in effect for the city.

Data Evidences•
• One Measure is implemented-Inclusion of Part 11 of National Building Code (NBC 2016) and/or Energy Conservation Building Codes (ECBC 2017) i.e. Draft ECBC Goa 2020 is notified in the State. 
• There is no functioning green building cell in ULB.
• There is no functioning high-level Green Building Committee in the city.
 Source: Survey

Mobirise Website Builder

Total Score

Total score of all the indicators under Energy and Green Buildings.

Solutions, Strategies & Interventions

To Improve the Score of Energy and Green Buildings

Mobirise Website Builder

City Planning

(Khalil, 2009)
• There is need to build a ring road to increase transportation efficiency and decrease energy consumption and pollution. Thus densifying existing urban areas instead of horizontal spread of the city.
• Advocating mixed uses as commercial/ residential uses to reduce personal vehicle usage.
• Wise location of needed services, appropriate rates per capita of services and facilities, and their concentration in single location central to community.

Mobirise Website Builder

Comparison of F.A.R.

(ESMAP, 2014)
• Prescribing FAR and building heights according to street width.
• Fine grain texture of plot subdivisions, buildings & building group.
• Ratio of office, commercial, and residential floors to building scale. 

Mobirise Website Builder

Urban Block

(ICLEI, 2021)
• Vernacular types of urban fabric.
Permeable designs, combining open plans and sections.
• Cooling intermediary spaces between indoors and outdoors by passive techniques.
• Promote zoning within block both horizontally and vertically.
• Mixture of density within the block.
• Shaping tall buildings in relationship to other buildings and to the wind to create favourable street and open-space micro-climates.
• Continuous landscaped public space inside and outside the block  

Mobirise Website Builder

Solar Valley Micro E Hotel, Dezhou, China.

Urban Economy

(IRENA, 2013)
• Incentives to business related to clean energy generation services to develop renewable energy as leading urban economic sector.
• Integration of Solar Energy generation in State Government owned buildings.
• Launch of a demonstration project, pilot project for introduction of Solar Power generation in buildings in the city.

Case Study: City of Dezhou, China
• Encouraging entrepreneurship in products and services used for the generation of solar, wind, hydro, geothermal and bioenergy.
• 120 solar energy enterprises which generate an annual turnover of USD 3.46 billion.
• City espoused the role of an incubator developing a viable industry cluster and that of multiplier by drawing upon the existing local solar business. 

Mobirise Website Builder

Building Envelope Retrofit

Building Envelope for Passive Cooling

(Barbara A. Maher & Clarke, 2013)
• Greenwall retrofit envelope on north-east-west façades of the existing buildings can help in protect the building from conducting direct solar heat.
• Balconies should be allowed to projecting into setback to shade passage and façades.
• Multilevel vertical plantation systems with drip irrigation.
• Greenwall system assemblies should be allowed in setback as a landscaping element.
• Solar Panel retrofit with MS Framing on Roof.
• Shallow rainwater tanks can be installed on rooftops.
• Water from rooftop tank can be used for Drip Irrigation system in Green Walls.

Mobirise Website Builder

Ward 28(Patto) via Google Earth.

Street & Walkway

(Indrani Gupta & Kumar, 2014)
• Reduce walking distance between the blocks in order to make the street more pedestrian friendly.
• Heat radiated by large paved & tarred surface area can be reduced through use of grass paver blocks which can also help in permeation of rain water.

Mobirise Website Builder

Discontinuity in Pedestrian Walkway


• In Ward 19 & 20, footpaths need to be repaired and made wheelchair friendly as well as encroachment by various parties is been observed and needs to be resolved.

Mobirise Website Builder

Section 22' - Shading the Street using Modular Parking Design


• Streets needs to be shaded from harsh sunlight to facilitate pedestrians at the same time integrating PV Systems to capture the abundantly available sunlight in the street to generate power for various purposes.

Total Score

Current Score and Estimated Score for Energy and Green Buidings
Mobirise Website Builder
Before Intervention
Mobirise Website Builder
Estimated After Intervention

By Gautam Parwar
M. Arch in Sustainable Habitat, 2022
Goa College of Architecture

Mobirise.com

Created with ‌

Mobirise